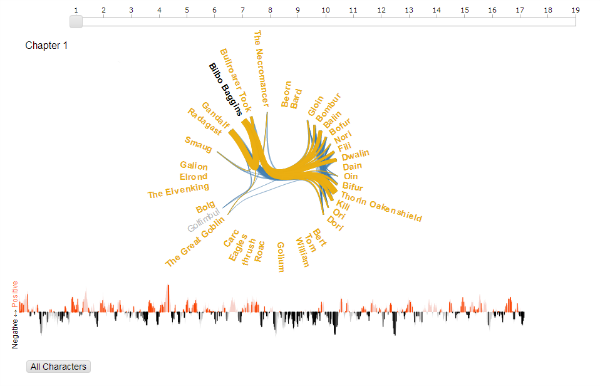
Natalia Bilenko, Ph.D student in Jack Gallant’s lab at the Helen Wills Neuroscience Institute at University of California, Berkeley, and Asako Miyakawa realized a dynamic graph of character relationships for three very different books, including The Hobbit by J.R.R. Tolkien.
This graph “displays the evolution of connections between characters throughout the book. Emotional strength and valence of each sentence are shown in a color-coded sentiment plot”. The instructions are simple:
- hovering over the sentence bars reveals the text of the original sentences
- the emotional path of each character through the book can be traced by clicking on the character names in the graph.
You can check out the whole project here and visit the Hobbit project at Natalia Bilenko’s website.


